AXS Bulls Dominate the Chart, but Resistance Cluster Could Halt the Rally
Axie Infinity’s AXS token has extended its recent streak of heightened volatility, with price action now pushing into a zone where bullish momentum is strong but also where sellers appear increasingly active.
The latest daily candle data shows a notable series of higher closes over the past week, signaling broad interest returning to the market. However, AXS is approaching several important resistance levels that historically tend to stall rallies unless backed by strong continuation volume.
Momentum Builds as EMAs Accelerate Upward
AXS continues to trade comfortably above both its 9-day and 20-day EMAs, with the shorter EMA rising meaningfully faster. This steepening gap reflects a market in which buyers remain firmly in control and momentum continues to expand.
When EMAs begin to accelerate together like this, it typically indicates sustained confidence and can support additional upside attempts.
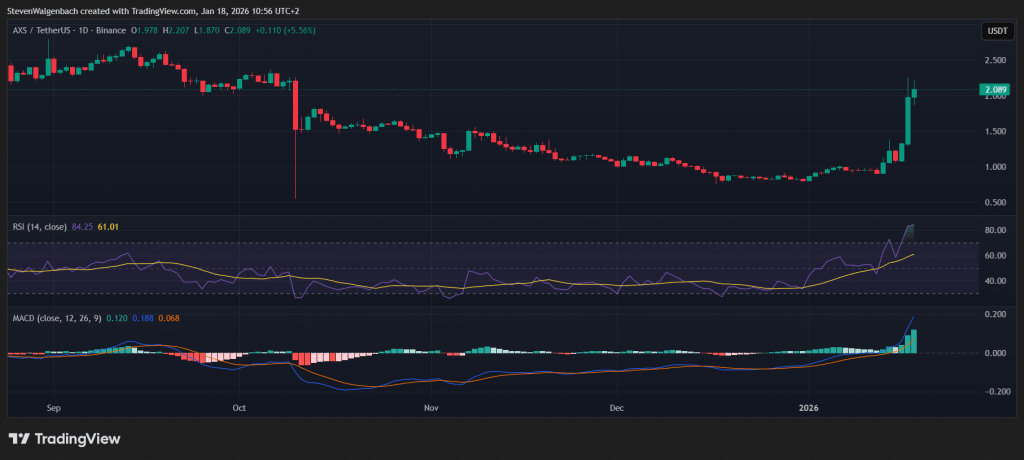
Daily chart for AXS/USDT (Source: TradingView)
The RSI reading, which has spent consecutive sessions in overbought territory, reinforces that narrative of aggressive bullish conviction. While an elevated RSI often signals risk of cooling, it more importantly highlights a market undergoing strong trend continuation—especially when accompanied by climbing EMAs.
The MACD’s widening positive histogram is another supportive factor, with improving trend strength and growing distance above the signal line. A MACD structure like this often precedes further upside attempts unless momentum abruptly fades.
Taken together, those indicators show a market with clear bullish pressure, though one that is also becoming stretched and vulnerable to sharp pullbacks if support becomes unstable.
AXS Price Approaches Heavy Resistance Levels
AXS is now heading toward a cluster of nearby resistance levels at $2.287, $2.309, and $2.338. These three levels form a narrow congestion band, meaning even moderate selling pressure could slow or reject the current rally.
This tightening structure suggests that, while bulls are in control, they must break through this resistance zone decisively to keep momentum alive. Failure to do so could trigger a short-term retracement back toward key support levels.
On the downside, the nearest support levels sit at $1.546 and $1.523, which together form a broad demand base. If sellers regain control, this zone is likely to serve as the first major test of whether bullish conviction remains intact.
Order Book Walls Highlight Where Volatility Could Explode
The order book reveals several bid and ask walls that may significantly influence the next large move.
Bid walls show where buyers are heavily concentrated:
- $1.888: losing this support could open a short-term drop of nearly 7%.
- $1.060: breaking this deeper wall risks a larger flush, with downside potential nearing 48%.
- $1.000: this is a psychological level and the largest protective wall. If it collapses, the market could face a dramatic loss exceeding 50%.
Those bids provide structural support, but if any cracks form, volatility could accelerate rapidly.
On the ask side, sellers appear strongest at:
- $2.161: clearing this opens room for a ≈6.6% move toward resistance.
- $2.494: breaking through could extend gains roughly 23%.
- $2.500: the largest selling wall; clearing it would potentially unleash a major continuation rally of over 23%.
Those ask walls show that while upside potential exists, it requires significant effort from buyers to overcome entrenched sell-side liquidity.
Potential Scenarios and Trade Setups
Bullish Scenario (Long Setup)
If AXS breaks through the resistance band between $2.287–$2.338, momentum could accelerate sharply—especially if the $2.161 ask wall is cleared first.
The EMAs and MACD trends support that scenario. A potential long entry may form on a clean breakout above this resistance cluster, with short-term upside targets aligning with the order-book-suggested extension zones.
A safer entry for trend traders would be a retest of the 9-day EMA following a mild pullback, provided the trend structure remains intact. Exits can be staged near the higher resistance walls or at signs of weakening MACD momentum.
Bearish Scenario (Short Setup)
If AXS becomes overheated and stalls below the resistance band, profit-taking may trigger a retracement toward the support region near $1.546–$1.523. A rejection candle at resistance—combined with slowing MACD momentum—could provide a viable short setup.
Short traders may also look toward the $1.888 bid wall; if this gives way, it could create an opportunity for a swift downside move. However, traders should note the risk of abrupt short squeezes given the strong bullish structure.
Overall Outlook
AXS remains strongly positioned from a momentum standpoint, with indicators leaning decisively bullish.
However, the crypto is sitting near an important inflection zone where resistance levels and large ask walls may dictate whether the rally extends—or pauses for a retracement.
Disclaimer: The information presented in this article is for informational and educational purposes only. It does not constitute financial advice. Ecoinimist is not responsible for any losses incurred. Readers should exercise caution before acting on this content.