
XRP Traders Watch $2.19 Resistance as Momentum Shifts Bullish
XRP’s latest price action on the daily chart reflects a steady improvement in bullish momentum following a brief period of consolidation.
The asset has climbed back above short-term trend markers, signaling that buyers are reasserting control. While XRP has not yet confirmed a full bullish reversal, the overall posture of the market shows a shift away from the weaker sentiment seen earlier in the week.
The alignment between price and the 9-day EMA reveals growing buyer participation, while the narrowing spread between the 9-day and 20-day EMAs often precedes a structural trend shift.
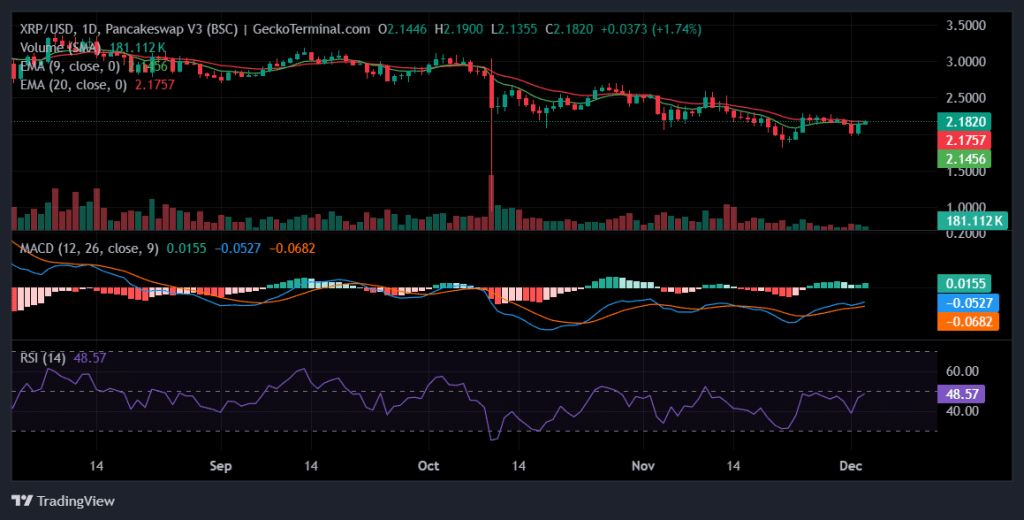
Daily chart for XRP/USD (Source: GeckoTerminal)
At the same time, momentum indicators such as the MACD are curving upward, with histogram expansion signaling fading bearish pressure. The RSI’s return toward a neutral-to-bullish zone reinforces that sentiment is stabilizing rather than deteriorating.
XRP Faces Resistance Cluster Ahead: The Levels Bulls Must Break
XRP now faces a tight resistance band that stretches across $2.1898, $2.2276, and $2.2446. This cluster acts as a multi-stage ceiling, and breaking each level requires fresh volume and sustained momentum.
Order-book data paints a clear picture of the challenges ahead. The ask wall at $2.20—holding over $413K USDT in supply—is the first major barrier. Clearing this level could open a modest window for continuation before XRP encounters the next layer of resistance.
Beyond that, ask walls at $2.25 and $2.26 represent much larger liquidity barriers. If buyers absorb these orders, XRP could gain several percentage points rapidly due to thinner liquidity above these ranges.
For bulls, those walls are not merely obstacles—they are breakout triggers. A close above the initial resistance, followed by strong bids clearing the order-book liquidity, would signal a structural shift toward a more pronounced bullish trend.
Support Levels Provide a Buffer, but Bid Walls Are Crucial
On the downside, XRP’s primary support region centers around $2.1453, $2.1398, and $2.1394. These levels form a critical price floor that must hold if the bullish momentum is to continue building.
Supporting that zone are multiple bid walls positioned just above those supports. Walls at $2.17400, $2.17370, and $2.17030 collectively represent nearly a million USDT worth of buyer demand. These walls currently act as stabilizers for the price, preventing deeper declines.
However, if any of them fall, XRP could see incremental losses of around 0.4%–0.6% per wall, potentially dragging price back into the deeper support zone.
A breakdown beneath that region would shift market sentiment back toward consolidation or short-term bearishness, especially if momentum indicators begin to roll over concurrently.
What the Technical Indicators Suggest
Momentum-based indicators point toward improving sentiment, with the MACD and RSI signaling recovery rather than deterioration. These conditions typically favor gradual upside continuation, but only if major resistance barriers are overcome.
The EMAs reinforce this interpretation: while the price has not yet decisively reclaimed the medium-term trend, it is no longer diverging from it. This often marks the early stages of bullish re-alignment.
Overall, the indicators lean cautiously bullish, but confirmation still depends on clearing the resistance cluster.
Potential Long and Short Trade Considerations
For long setups, the cleaner entry emerges once XRP closes above the first resistance at $2.1898 and successfully clears the ask wall at $2.20. This would signal that buyers have enough conviction to absorb existing sell pressure. Additional take-profit zones align naturally with the following resistance levels at $2.2276 and $2.2446, where liquidity density increases.
Further upside becomes more likely if XRP breaks the liquidity-heavy $2.25–$2.26 region. Such a move could trigger a stronger bullish continuation fueled by thinner supply conditions above.
For traders seeking short opportunities, rejection wicks or multiple failures at $2.1898—or persistent absorption at the $2.20 ask wall—create setups for moves back toward the bid walls.
If the bid walls at $2.17400 or $2.17030 collapse, downside acceleration into the $2.14 region becomes more probable. Continued weakness below this support complex would shift sentiment back in favor of the bears.
Conclusion: XRP Approaches a Decisive Breakout Zone
XRP’s market posture has strengthened, and buyers are showing renewed interest. But the next phase of price action depends heavily on how the market interacts with the stacked resistance levels ahead.
The improving indicators offer a supportive backdrop, yet liquidity barriers remain the key deciding factor in whether XRP breaks higher or slips back into consolidation.
Disclaimer: The information presented in this article is for informational and educational purposes only. It does not constitute financial advice. Ecoinimist is not responsible for any losses incurred. Readers should exercise caution before acting on this content.


