Solana’s Chart Compresses: What the Bid and Ask Walls Say About the Next Move
Solana enters a critical phase on the 1-day chart, with price movement compressing between key resistance levels overhead and strong layers of support below.
The recent daily closes show a slow drift downward from the mid-$140 zone, but the selling pressure is softening, hinting that momentum may be preparing to shift. Whether the market breaks higher or lower will depend heavily on how the price interacts with the most active liquidity clusters in the order book.
Short-Term Trend Weakens But Shows Early Stabilization
Solana remains below both the 9-day and 20-day EMAs, a configuration that typically signals short-term weakness.
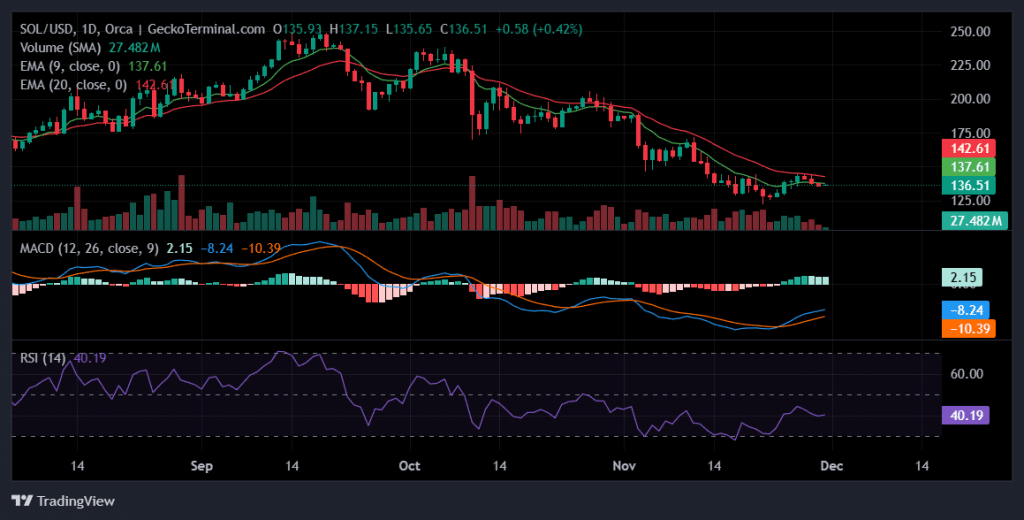
Daily chart for SOL/USD (Source: GeckoTerminal)
Sellers still maintain the advantage, but the EMAs are flattening, suggesting the downtrend is losing steam rather than accelerating. This transition often precedes a reversal attempt if demand begins to build around support levels.
The RSI in the low-40s confirms that momentum is still bearish, though not deeply oversold. This places the market in a zone where either a relief bounce or a fresh wave of selling could emerge.
The MACD’s positive histogram, even while the trend remains negative overall, highlights that bearish momentum is fading. Indicators together paint a picture of deceleration, not collapse.
Key Resistance Levels That Solana Must Break
Solana faces a tight cluster of resistance that has repeatedly capped upside moves.
The first barrier sits at $139.02, a level where the price has struggled to reclaim momentum. A breakout here could allow the market to challenge the next band around $143.64, followed by the broader resistance zone near $146.48.
Those resistance levels align with dense order-book liquidity. Large ask walls at $143, $144, and $145 represent strong sell-side pressure. Clearing each wall could trigger rapid expansions higher — approximately 4.9%, 5.6%, and over 6% respectively — as liquidity thins between these levels. Bulls must clear these stacked barriers to initiate a meaningful trend reversal.
Support Levels and Buyer Defense Zones
On the downside, $135.32 remains the most tested and immediate support. A deeper drop would expose the next layers at $131.71 and $131.37, both of which sit just above aggressive bid-side liquidity.
The order book shows a massive bid wall at $130 holding more than 11,620 SOL, making it the strongest line of defense. This is followed by additional deep liquidity at $130.75 and $129.29. These walls could absorb significant sell pressure and trigger sharp bounces, but if they break, the Solana price could quickly shed 4–5% and risk cascading into a lower range.
Order Book Dynamics: Where the Next Big Move Begins
The liquidity profile paints a picture of compression. Heavy bid walls cluster below $131, while stacked ask walls form a ceiling at $143–145. This type of structure often precedes volatility as one side eventually gives way.
If bulls can push the Solana price into the $139–144 range and begin clearing sell walls, momentum could shift decisively upward. But if bears drive the price back toward the $130 liquidity shelf and absorb it, a swift breakdown could follow.
The order book shows strong interest from both sides, increasing the likelihood of an explosive breakout once one direction gains control.
Potential Long Setups
More cautious long traders may wait for a breakout above $139.02, which would confirm renewed buying pressure. A more aggressive entry sits near support around $135.32, where demand has shown signs of stabilizing.
Upside targets for long positions include the resistance levels at $143.64 and, if momentum strengthens, $146.48, particularly once the $143–145 ask-wall cluster is cleared. Stop-loss placement just below the $135 area reduces risk against potential liquidity-driven breakdowns.
Potential Short Setups
Short positions remain valid as long as Solana trades beneath the EMAs and fails to secure a foothold above the resistance cluster. Rejections from $139.02 or the denser sell wall around $143 offer clean short entries.
Downside targets sit at $135.32, then $131.71, with stops ideally placed above the $143–144 zone where short momentum would be invalidated. A failure in the $130–131 liquidity pocket would open the door to a deeper retracement.
Conclusion
Solana is reaching a tightening apex between stacked liquidity barriers.
Indicators show bearish pressure cooling, but not yet reversing. Whether SOL breaks above the $143–145 resistance zone or slips toward the $130 liquidity shelf will determine its direction heading into December.
Traders should prepare for volatility as soon as one of these major walls gives way.
Disclaimer: The information presented in this article is for informational and educational purposes only. It does not constitute financial advice. Ecoinimist is not responsible for any losses incurred. Readers should exercise caution before acting on this content.


