
XRP Climbs 6% as RSI Recovers—But Resistance Cluster Still Looms
XRP is attempting a mild rebound after a string of weaker daily closes, according to data from the Ecoinimist markets page. However, its overall structure still reflects a market struggling to regain upside momentum.
While the latest daily candle shows buyers stepping back in above the lower support band, XRP remains below its short-term and mid-term trend EMAs—an area that continues to cap upside attempts and signals that the broader environment remains cautious.
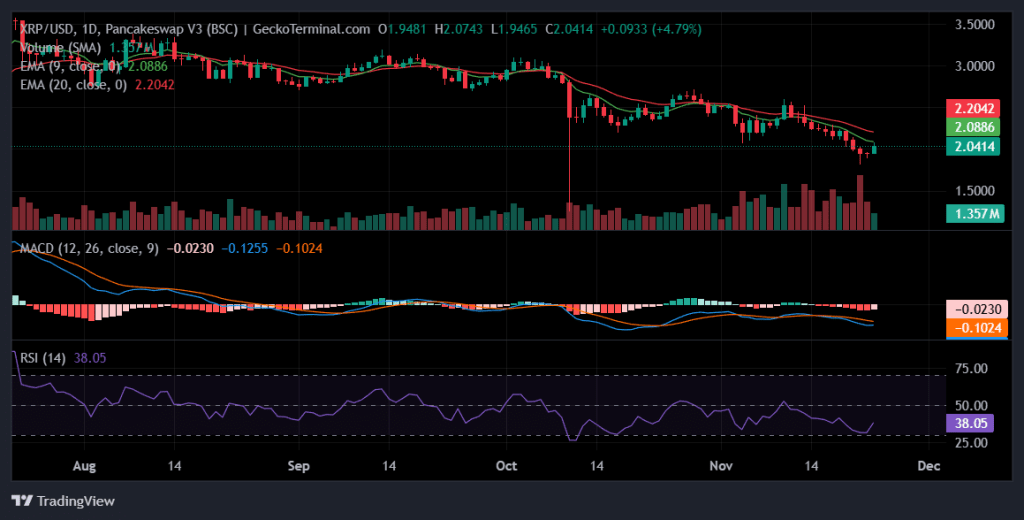
Daily chart for XRP/USD (Source: GeckoTerminal)
The recent behavior of the 9-day and 20-day EMAs reinforces the cautious tone. Both are sloping downward and positioned above current XRP price action, suggesting that rallies are meeting overhead pressure quickly.
When EMAs compress and lean downward together, it’s generally a sign that momentum favors the sellers despite occasional relief bounces.
This backdrop makes the upcoming test of nearby resistance levels particularly important for XRP’s direction in the days ahead.
XRP Momentum Indicators Show Weakness but With Early Stabilization
The MACD remains in negative territory, reinforcing that bearish momentum still outweighs bullish pressure.
Although the histogram shows signs of shrinking downside momentum, it has not yet flipped into positive territory. This often suggests the early stages of stabilization rather than a confirmed trend reversal. Traders typically view this type of MACD behavior as a signal that the market may be preparing for a broader consolidation phase before attempting a stronger directional move.
The RSI, meanwhile, has spent several sessions near oversold territory but is now curling upward. This shift reflects buyers stepping in at lower levels and absorbing short-term selling. Historically, when the RSI climbs off compressed lows like this, the asset often enters a recovery phase toward key resistance areas—though whether it can sustain that attempt depends on order-book liquidity and how the XRP price behaves at the EMA cluster above.
Support Levels Hold—But Only Just
XRP bounced off the upper band of its support zone between $2.0216 and $2.0172, an area that has repeatedly acted as a defensive line for buyers.
A deeper breakdown toward $1.7963 would signal a major structural shift, as that level represents the broader medium-term support floor.
For now, bulls have managed to protect the immediate support zone, but the lower highs forming across recent sessions make this defense increasingly fragile.
Order-book data adds nuance to the support picture.
Large bid walls at $2.0352 and $2.0316 are currently providing the most meaningful buy-side liquidity. If the $2.0316 bid wall—holding more than 178,000 units—collapses, the XRP price could slide roughly 0.34% very quickly.
A second break below $2.0352 would add further pressure. The most critical bid wall sits at $2.0126, where a failure could trigger a sharper 1.28% drop and potentially open the door for a test of the broader support region around $2.0172–2.0216 or even lower.
Resistance Cluster Creates a Tough Ceiling
On the upside, XRP is facing a tight trio of resistance levels at $2.1442, $2.1598, and $2.1898. These levels align with a downward-tilting EMA structure, creating a layered ceiling that will be difficult to break unless momentum strengthens significantly.
The order-book also shows heavy sell liquidity just above current price. An ask wall at $2.0480 and another at $2.0493 are currently acting as the first line of resistance. Clearing them could open the path toward a modest 0.46%–0.52% rise.
The more important wall sits at $2.1000, holding nearly 394,000 units. If bulls manage to break through this wall, the XRP price could accelerate upward by about 3%, making a run toward the resistance cluster far more achievable.
Potential Scenarios and Trade Setups
In its current posture, the XRP price appears cautiously neutral-to-bearish. The downward EMAs and negative MACD favor the downside, while the rising RSI suggests a short-term relief phase. This mixed landscape opens the door for both bullish and bearish opportunities depending on how price interacts with the nearby liquidity walls.
For long traders, the most compelling early signal would be a decisive break above the stacked ask walls near $2.048–$2.100 followed by stable trading above that range.
Such a move would confirm that buyers have absorbed the bulk of sell pressure and may push toward $2.1442. A sustained daily close above this first resistance could unlock momentum toward $2.1598 and $2.1898.
For short traders, a rejection at the EMA cluster combined with a breakdown of the $2.0352 and $2.0316 bid walls would be the cleanest signal. A breach of $2.0126 would strengthen the bearish case significantly, potentially exposing the deeper support zone and a larger correction. Until then, the risk-reward for aggressive shorts remains moderately favorable but requires careful monitoring of how price engages with the bid walls.
As it stands, XRP is at a pivotal moment: short-term relief is developing, but the broader trend remains under pressure. The next break—either above the dense liquidity zone at $2.05–$2.10 or below the bid wall cluster near $2.03–$2.01—will likely define the next strong directional move.
Disclaimer: The information presented in this article is for informational and educational purposes only. It does not constitute financial advice. Ecoinimist is not responsible for any losses incurred.Readers should exercise caution before acting on this content.


