Can ICP Hold the Line? Internet Computer Faces Key $3 Support Test
The Internet Computer Protocol (ICP) token has experienced an impressive surge in recent sessions, rising from below $3 to test the $4.30 region before encountering resistance.
However, the current market setup suggests a period of consolidation may follow as short-term momentum cools and traders weigh their next moves.
ICP Momentum Fades After Sharp Rebound
After breaking through the $3.50 level with conviction, ICP’s bullish drive began to lose steam near the $4.30–$4.60 resistance area. The price action shows a strong upward impulse that pushed momentum indicators into overbought territory before easing slightly.
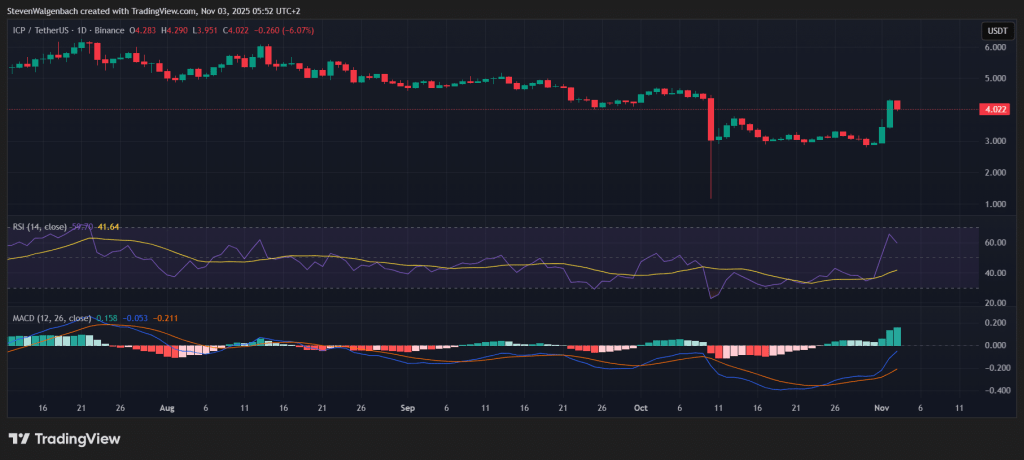
Daily chart for ICP/USDT (Source: TradingView)
The Relative Strength Index (RSI), which recently climbed above the mid-60s, reflects waning bullish pressure but not outright weakness. This points to a possible consolidation or minor retracement before another attempt higher.
The exponential moving averages (EMAs) indicate that short-term momentum has shifted in favor of the bulls. The 9-day EMA has crossed above the 20-day EMA, suggesting improving trend strength. As long as price action remains above the short-term EMA cluster near $3.50, ICP is likely to maintain its bullish structure.
Order Book Reveals Key Walls
The order book data reveals strong liquidity clusters that could determine ICP’s next move. On the downside, a major bid wall sits around $3.09, where nearly 194,000 tokens await purchase — a zone worth over $600,000 USDT. If this level breaks, ICP could suffer a sharp decline of almost 24%, making it a critical support to watch.
Further below, additional buy walls at $3.65 and $1.50 act as secondary buffers. A breakdown below these could open the door to deeper corrections of roughly 10% and 63%, respectively.
On the upside, ask walls near $4.50, $5.00, and $5.50 represent key obstacles for bulls. Clearing the $4.50 zone could drive a move toward $5, while breaching the $5.00 wall could unleash momentum toward $5.50 and above — translating to gains between 10% and 35% from current levels.
Resistance and Support Levels in Focus
From a structural standpoint, ICP faces immediate resistance at $4.66, followed by $4.91 and $5.05, all of which align with the aforementioned ask walls.
The most important support area remains the $3.00–$3.05 zone, which also corresponds to both historical reaction points and high liquidity demand. Maintaining this range could reinforce the bullish narrative, but losing it would likely trigger stronger selling momentum.
Bullish or Bearish Outlook?
Technically, ICP remains bullish in the medium term, supported by a constructive crossover of moving averages and a positive MACD histogram that suggests growing bullish momentum. However, short-term traders should watch for profit-taking near resistance levels.
If buyers defend the $3.50–$3.00 support area, a rebound toward $4.90 or even $5.50 is plausible. Conversely, a sustained drop below $3.00 could shift sentiment bearish and invite further downside pressure.
Trading Considerations
For long traders, a potential entry zone lies near $3.50–$3.10, ideally after a retest and stabilization around these supports. Profit targets could be set near $4.90 and $5.50.
For short traders, failed breakouts above $4.60–$4.90 could present opportunities to fade the rally, with profit-taking near the $3.50 level.
Disclaimer: The information presented in this article is for informational and educational purposes only. It does not constitute financial advice. Ecoinimist is not responsible for any losses incurred. Readers should exercise caution before acting on this content.