
Trump Token Builds Momentum — Can TRUMP Break Above $9?
Trump (TRUMP) has shown steady bullish momentum over the past several sessions, with its price gradually recovering from earlier pullbacks and climbing toward the mid-$8 range.
The token’s price action on the 1-day chart signals strengthening upward momentum supported by improving trend indicators and bullish positioning in the order book.
TRUMP Momentum Shifts in Favor of the Bulls
The 9-day and 20-day exponential moving averages (EMAs) have both been rising steadily, suggesting that short-term sentiment continues to lean bullish. The gap between the 9 EMA and the 20 EMA has widened slightly, reflecting sustained buying interest. This kind of EMA alignment typically indicates that buyers are maintaining control and that the recent uptrend could extend if momentum continues to build.
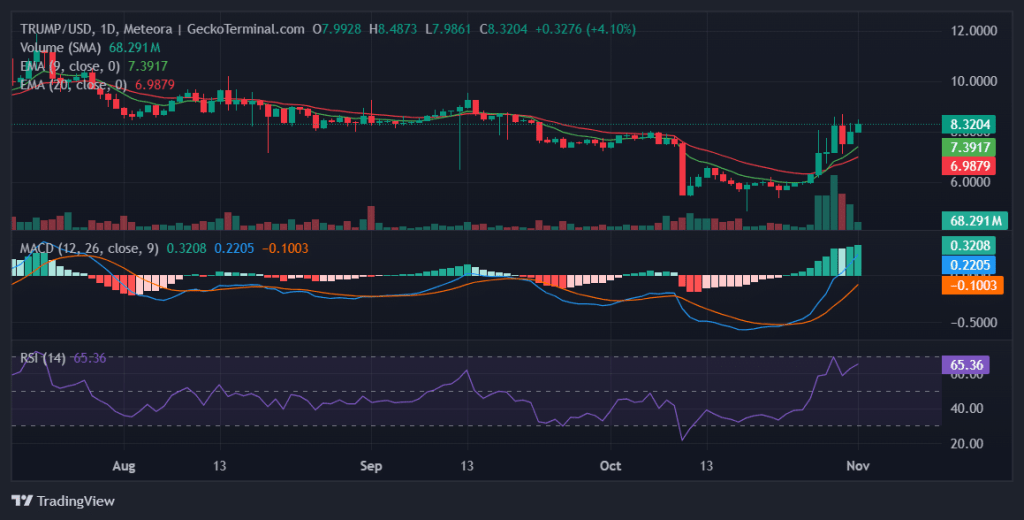
Daily chart for TRUMP/USD (Source: GeckoTerminal)
The MACD indicator reinforces this bullish bias. The MACD line has crossed above the signal line and remains in positive territory, signaling a continuation of upward pressure. The histogram’s consistent growth implies that bullish momentum is not only present but also gaining strength as buying volume expands.
RSI readings in the mid-60s indicate healthy bullish momentum without entering overbought territory. This balance between enthusiasm and caution often precedes another potential leg up, as traders see room for continued upside before risk of exhaustion sets in.
Key Resistance and Support Levels
Immediate resistance lies between $8.63 and $8.69, a zone that has capped the token’s advances several times in recent sessions. A breakout above this area could open the door to the next target near $9.25, where sellers may again try to assert control.
On the downside, the first support level sits at $8.28, followed by $8.19 and the stronger base near $7.57. These areas represent potential zones where short-term buyers may re-enter if the price experiences a pullback.
Order Book Dynamics Highlight Strategic Barriers
The order book reveals several notable liquidity walls that could dictate near-term price action. On the buy side, a major bid wall stands at $7.69 with roughly 61,275 units — about $471,000 worth of demand. This suggests strong buyer interest at this level, though a break below could trigger a 7–8% downside correction. Another significant wall sits at $7.00, which, if lost, could accelerate losses of over 16%.
On the sell side, the largest ask wall is positioned at $10.00 with over 74,000 units, representing roughly $743,000 in potential selling pressure. Clearing this barrier could propel TRUMP nearly 20% higher toward its next resistance target. Intermediate asks at $9.50 and $8.80 mark additional checkpoints for bulls, each capable of triggering further upside momentum if breached.
Potential Trade Scenarios
For long traders, a confirmed breakout above $8.70 could serve as a compelling entry point, targeting $9.25 and possibly $9.50, with stop-losses placed just below the $8.20 support zone to manage downside risk. Conversely, short traders might look for rejection candles or weakening momentum signals near the $9.20–$9.50 zone as opportunities to enter positions anticipating a correction toward $8.30 or lower.
Overall, the technical structure of TRUMP remains firmly bullish. Trend indicators, momentum oscillators, and liquidity distribution all favor continued upward action — though traders should stay alert to resistance reactions and volume shifts that could alter the short-term outlook.
Disclaimer: The information presented in this article is for informational and educational purposes only. It does not constitute financial advice. Ecoinimist is not responsible for any losses incurred. Readers should exercise caution before acting on this content.


