
TAO Gears Up for Major Move With Bullish Momentum Building
TAO has extended its rebound, climbing steadily from the mid-$400 range to above $500 as buyers continue to dominate the daily chart.
The alignment between the 9-day and 20-day EMAs indicates that short-term momentum is reinforcing the broader uptrend. The 9 EMA has pulled decisively above the 20 EMA, showing that buyers remain in control and sentiment remains bullish.
TAO MACD and RSI Signal Growing Bullish Strength
Momentum indicators confirm this optimism. The MACD line remains well above the signal line, with the histogram expanding positively—reflecting accelerating bullish momentum. This suggests that market participants are increasingly confident in TAO’s ability to sustain higher levels, potentially paving the way for a push toward the $560 and $600 resistance zones.
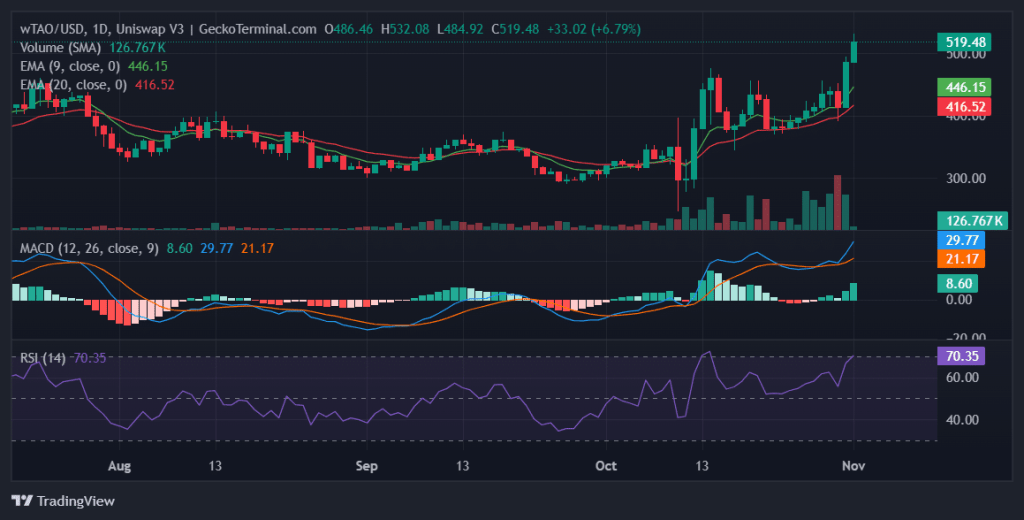
Daily chart for wTAO/USD (Source: GeckoTerminal)
The RSI hovering near the 70 mark highlights the asset’s strong momentum but also signals that TAO is approaching overbought conditions. While this does not imply an imminent reversal, it does suggest that short-term corrections could occur before the next leg up. Traders should watch for consolidation near support zones before considering new long entries.
Support and Resistance Dynamics
The nearest supports at $497, $486, and $482 are critical to maintaining bullish structure. These levels mark previous consolidation areas where buyers have repeatedly stepped in. If TAO remains above $497, it is likely to continue its upward push toward the next resistance targets at $562, $603, and $606.
However, if the price slips below $482, it could trigger a deeper pullback, potentially invalidating the bullish setup and opening the door for a short-term retracement. In that case, traders may see a move back toward the stronger bid wall zones identified below.
Order Book Analysis: Liquidity Walls Define the Next Move
TAO’s order book shows a firm layer of buying support. The most significant bid wall sits at $420 with 1,510 units—representing a substantial liquidity base. A breakdown below this level would imply a potential 18.7% drop, signaling a structural shift toward bearish conditions.
Additional buy-side liquidity sits at $450 and $440, where smaller but meaningful bid walls could cushion declines and act as springboards for new rallies. On the upside, key ask walls are positioned at $540, $550, and $600. Clearing these barriers could propel TAO to the next resistance zone, with a breakout above $600 likely confirming a continuation toward new highs.
TAO Trading Strategy Outlook
For bullish traders, maintaining exposure above $497 offers an attractive setup. A sustained breakout above the $550 ask wall could serve as an entry confirmation, with profit targets around $603–$606. Risk management would require stops below $480, where trend invalidation becomes more likely.
Conversely, for short-term bears, failed retests of $550–$560 combined with weakening momentum could offer opportunities for quick pullbacks toward $500 or lower. However, given the strong bullish structure, short positions should be approached cautiously unless a clear breakdown below $482 materializes.
Disclaimer: The information presented in this article is for informational and educational purposes only. It does not constitute financial advice. Ecoinimist is not responsible for any losses incurred. Readers should exercise caution before acting on this content.


