
Crypto Traders Turn Bullish on Jupiter (JUP) as Technicals Signal Uptrend
Recent Jupiter (JUP) price action has started to show hints of renewed bullish interest after several sessions of steady upward momentum.
The token climbed consistently from its prior lows, supported by improving technical indicators that suggest market sentiment may be shifting from bearish exhaustion to cautious optimism.
Jupiter Momentum Strengthens as Bulls Gain Ground
The short-term exponential moving averages (EMAs) have started to flatten and converge, a sign that bearish momentum is losing steam.
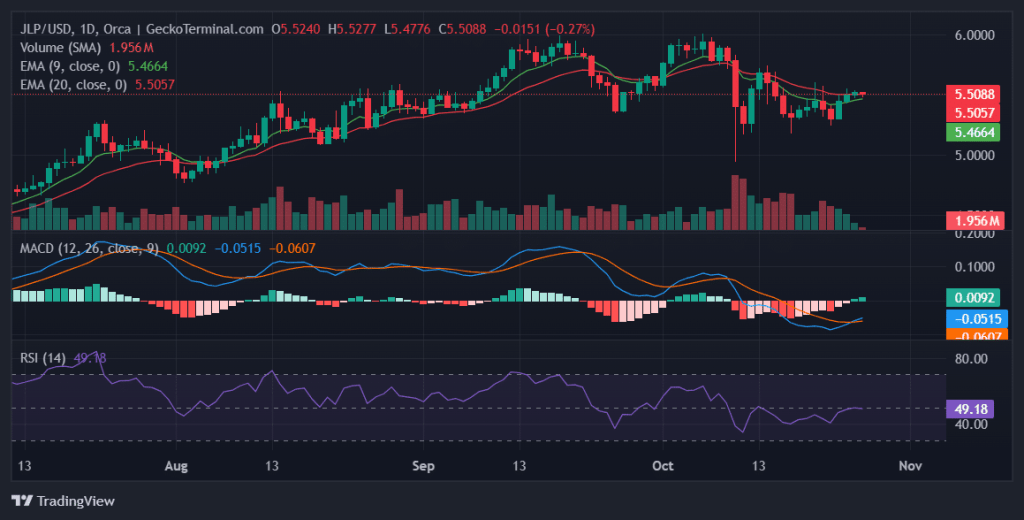
Daily chart for JUP/USD (Source: GeckoTerminal)
The 9-day EMA, which had been trending below the 20-day EMA for weeks, is now edging closer to it. This narrowing gap indicates a potential crossover — a key technical signal that could confirm a shift toward bullish control. Traders often view this as an early sign of trend reversal when it coincides with improving volume and market confidence.
Meanwhile, the MACD histogram has steadily climbed toward positive territory. This shows that buying pressure is gradually increasing for Jupiter, with the difference between the MACD and its signal line shrinking. While still modest, this upward movement reflects the early stages of bullish divergence — the kind of subtle transition that can precede a stronger breakout if momentum continues to build.
RSI and Price Structure Point Toward Gradual Recovery
The Relative Strength Index (RSI) has advanced from the mid-30s into the mid-50s, confirming a steady recovery from oversold conditions. This move suggests that buyers are regaining control but have not yet reached overheated territory, leaving room for continued upward pressure before overbought levels are tested.
Price-wise, Jupiter has managed to establish a local support base near $0.4278, a level that has repeatedly cushioned downside attempts. If this support remains intact, traders may look for a potential push toward the next resistance levels at $0.4651, $0.4731, and $0.4831.
A decisive break above the first of these could accelerate buying momentum and validate a mid-term reversal pattern.
Jupiter Order Book Analysis: Major Barriers and Safety Nets
The order book shows a strong concentration of liquidity on both sides, indicating key psychological and structural levels for the market.
On the bid side, the largest support appears at $0.10, where a massive wall of over 2 million units sits — roughly $207,000 worth of JUP. Losing this level would represent a catastrophic 76% downside risk, potentially triggering a deep retracement.
Two other notable bid walls are positioned at $0.13 and $0.069, offering interim liquidity buffers, though their break would signal significant market capitulation.
Conversely, the ask side presents a formidable set of resistance walls that could dictate the pace of any upward advance. A major wall at $0.50 could cap short-term gains unless buyers absorb the roughly $93,000 supply at that level.
Above that, thicker resistance at $0.7759 and $0.84 represent strategic targets — clearing these could unleash price expansion of up to 80–95% toward the next structural resistances.
Trading Outlook: Long and Short Setups
For bullish traders, potential entry points lie near $0.4278, provided that level holds and volume confirms accumulation. A successful breakout above $0.4651 may open room toward $0.4831, offering a short-term long opportunity with a tight stop below $0.4213.
Bearish traders, on the other hand, may look for rejection candles around $0.4731 or $0.4831 — zones likely to attract profit-taking and selling pressure. A failure to hold $0.4278 could trigger a move toward the $0.4213 support or even lower, aligning with short setups.
At present, indicators lean cautiously bullish, but with key resistances still unbroken, the broader outlook remains neutral to mildly positive. Sustained momentum above the 20-day EMA would confirm a trend reversal and likely attract fresh capital inflows.
Disclaimer: The information presented in this article is for informational and educational purposes only. It does not constitute financial advice. Ecoinimist is not responsible for any losses incurred. Readers should exercise caution before acting on this content.


