
BNB Faces Crossroads as Momentum Weakens and Order Book Pressures Build
BNB’s daily chart shows growing hesitation following its recent struggle to hold above the $1,100 mark. After a modest recovery attempt, the token has entered a phase of sideways consolidation marked by lower highs and waning bullish strength. This price behavior signals uncertainty among traders and suggests that buying pressure is no longer dominating the short-term trend.
EMAs Point to Waning Bullish Momentum
The short-term exponential moving averages (EMAs) have started to flatten, reflecting a slowdown in upward momentum. The 9-day EMA slipping below the 20-day EMA confirms that bulls are losing control, with the price now hovering beneath both indicators. This crossover often precedes a period of consolidation or potential downside if buyers fail to regain momentum.
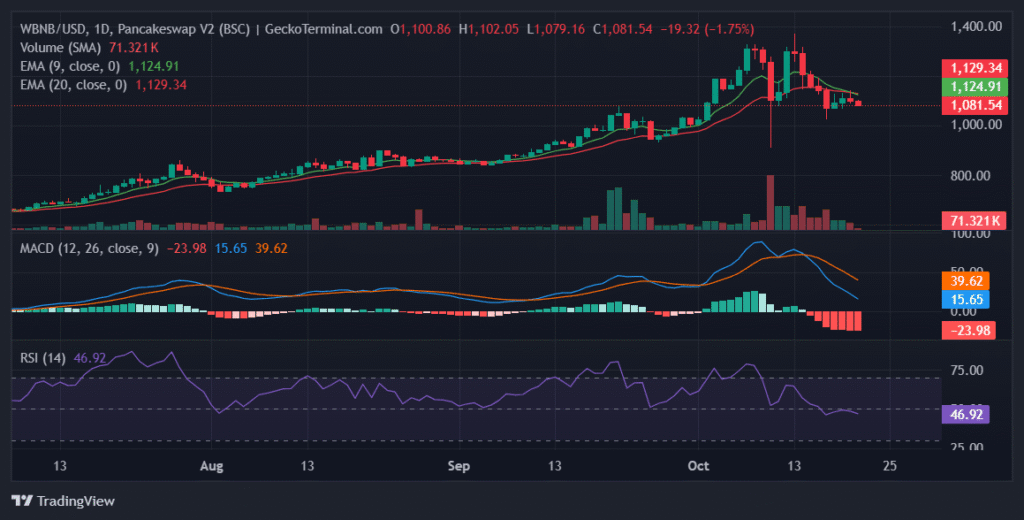
Daily chart for WBNB/USD (Source: GeckoTerminal)
The narrowing distance between the EMAs also highlights the ongoing tug-of-war between buyers and sellers.
MACD and RSI Confirm a Neutral-to-Bearish Outlook
Momentum indicators reinforce the view of weakening bullish strength. The MACD remains in negative territory, with its signal line still above the MACD line — a sign that selling pressure is persisting even if it’s not intensifying. Meanwhile, the histogram bars are contracting slightly, suggesting that the market could be stabilizing rather than entering a sharp correction. The Relative Strength Index (RSI), hovering below the neutral 50 zone, underscores the lack of conviction from bulls, keeping the overall sentiment tilted slightly bearish.
Key Support and Resistance Levels
BNB faces a crucial resistance at $1,307 — a level that previously rejected upward attempts and represents a psychological ceiling for traders. A sustained move above this resistance could confirm renewed bullish control and open the path toward higher targets. On the downside, immediate support lies around $945, followed by stronger historical levels near $843 and $839. A break below these supports could invite deeper retracements if broader market sentiment weakens.
BNB Order Book Analysis: Pressure Building on Both Sides
The order book data reveals a tense balance between buyers and sellers. Several significant bid walls are clustered around $1,074–$1,079, each containing roughly 240–250 units of BNB, totaling more than $750,000 in buying pressure. These layers indicate strong near-term support and could act as buffers against sudden drops. However, if these bid walls are breached, the price could fall up to 1%, potentially triggering additional downside momentum.
On the flip side, multiple ask walls between $1,091 and $1,094 are acting as barriers to upward movement. Clearing these sell orders could propel BNB roughly 0.8% higher toward the next resistance area, possibly sparking a short-term relief rally if buying activity strengthens.
BNB Trading Strategy and Outlook
BNB currently sits at a pivotal zone where both long and short traders have clear opportunities. Bulls may look to enter around current levels if the bid walls hold and the RSI begins turning upward, targeting a short-term move toward $1,130 and the higher resistance near $1,307. Conversely, bearish traders could consider short positions if BNB breaks decisively below the $1,074 support zone, which could open the path toward $945 and beyond.
Overall, the market’s tone remains neutral-to-bearish, with momentum indicators hinting at continued consolidation. Unless BNB reclaims the $1,120–$1,130 range with strong volume, the path of least resistance may remain sideways to slightly downward in the near term.
Disclaimer: The information presented in this article is for informational and educational purposes only. It does not constitute financial advice. Ecoinimist is not responsible for any losses incurred. Readers should exercise caution before acting on this content.


