Solana Defends $180 Level, Eyeing Breakout Above $185
The Solana price is at a pivotal stage after a deep correction, with bulls attempting to reclaim lost ground.
The daily chart shows potential for stabilization as technical indicators begin to flatten out, hinting at a possible recovery if current support zones hold firm.
Solana Trend Overview: Bulls Attempt a Comeback
Following a steep decline from above $220 to the $180 region, Solana has entered a consolidation phase.
The 9-day and 20-day EMAs are beginning to converge, suggesting that bearish momentum is losing strength. This EMA alignment often precedes a potential trend reversal, especially when accompanied by improving buying volume.
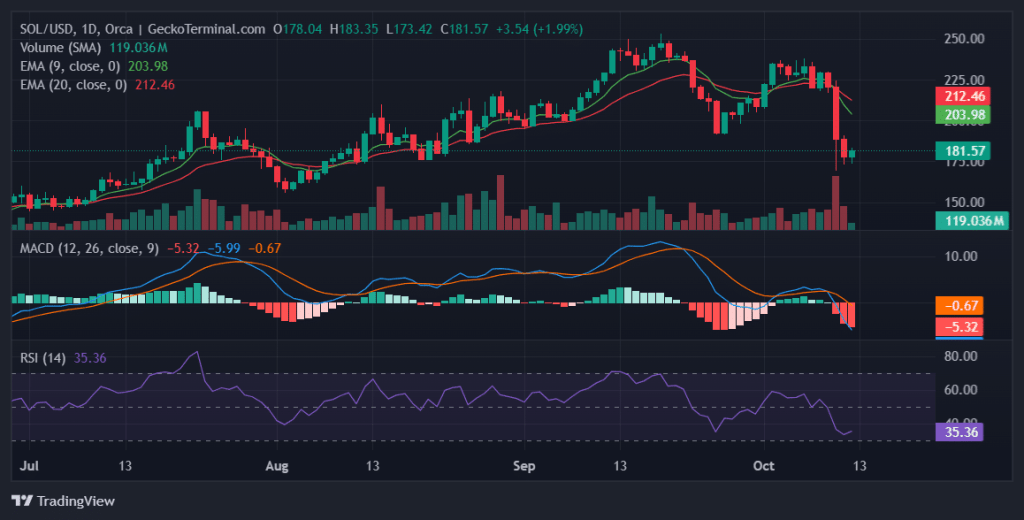
Daily chart for SOL/USD (Source: GeckoTerminal)
Momentum indicators reinforce this shift — the MACD histogram has started to flatten, showing that selling pressure is waning, while the RSI has bounced from oversold territory, signaling a gradual return of bullish strength.
Support Zones Under Pressure
The market’s current focus is on defending the lower levels between $180.52 and $176.22. These supports have historically attracted dip-buying activity, and a firm defense here could form the base for a new uptrend.
However, a breakdown below $175 could open the door to further downside toward $171.85, where another strong liquidity pool exists.
Resistance Levels and Upside Potential
On the upside, Solana faces a cluster of resistance points between $183.75 and $184.90. A decisive breakout through this range would likely trigger a short-term bullish reversal, pushing price action toward the psychological barrier at $190.
A sustained close above that mark could reaffirm bullish control and reignite momentum toward the $200 zone.
Solana Order Book Dynamics: Walls Defining the Battle
The order book data highlights intense positioning on both sides. A massive bid wall at $175.00 — totaling 10,909 units (~$1.9 million USDT) — is currently acting as a major shield for bulls. If this wall holds, it could provide the springboard for a rebound. However, a breach here could send SOL down by roughly 3.36%, with further declines to $173 or $172 if subsequent walls give way.
On the sell side, heavy ask walls at $186.60, $189.00, and $190.00 — representing millions in sell orders — stand as major hurdles for upward momentum. Clearing these zones would unleash pent-up demand and could propel SOL toward its next resistance region with increased conviction.
Trading Strategy: Identifying Entry and Exit Zones
For bullish traders, the $176–$180 region presents an appealing entry zone, provided that the bid walls remain intact and volume increases. Potential upside targets lie near $185–$190, while stop-losses should be placed just below $175 to mitigate downside risk.
Bearish traders, meanwhile, may look for short entries if Solana fails to hold above $175, targeting $171–$172 for profit-taking. A breakdown below this level could extend the correction, though such a move would likely coincide with renewed selling pressure across the broader crypto market.
Outlook: A Battle Between Accumulation and Resistance
Solana’s technical picture shows the market balancing between accumulation and resistance. The short-term outlook depends heavily on whether buyers can maintain control near the $175 bid wall.
A strong defense here could fuel a rebound toward $190, while a breakdown may invite another leg lower. The coming days will be critical in defining whether SOL’s recent slide turns into a long-term reversal or deeper consolidation.
Disclaimer: The information presented in this article is for informational and educational purposes only. It does not constitute financial advice. Ecoinimist is not responsible for any losses incurred. Readers should exercise caution before acting on this content.


