
Ethereum Chart Flashes Early Signs of Upside Momentum
Ethereum (ETH) is showing signs of stabilization after a turbulent pullback that saw prices dip toward the mid-$3,700 range.
Technical indicators now suggest that selling momentum is waning, with bullish sentiment gradually returning to the market.
Momentum Indicators Hint at a Shift in Market Sentiment
The convergence of Ethereum’s short-term and long-term exponential moving averages (EMAs) signals that the bearish phase may be losing traction.
When shorter EMAs begin flattening and closing in on longer-term averages, it often indicates the market is transitioning from decline to consolidation — or even the start of a reversal.
The MACD, which had been deeply negative, is now showing reduced selling pressure as the histogram turns less aggressive. This early shift points toward improving bullish momentum, suggesting Ethereum may be preparing for another upward leg if volume supports the move.
RSI Rebound Reflects Renewed Buying Interest
Ethereum’s relative strength index (RSI) has climbed back into neutral territory after previously dipping into oversold levels. This rebound suggests that sellers may be exhausted and that buying demand is slowly recovering.
A sustained RSI move above 50 would strengthen the case for a continued rebound in the days ahead.
Ethereum Order Book Walls Define a Tight Trading Range
The Ethereum order book data reveals a tightly contested battle between buyers and sellers. Strong bid walls at $3,835–$3,838 indicate that bulls are defending this level vigorously, while substantial ask walls around $3,840–$3,850 highlight where sellers are currently concentrated.
A successful breach above $3,850, where over $1.4 million in sell orders are stacked, could ignite a quick rally of around 0.3% to the next resistance level. Conversely, failure to maintain strength above $3,830 might lead to a short-term retest of deeper supports.
Support and Resistance Levels Shape the Next Move
Key resistance levels remain at $3,865, $3,872, and $3,986, marking zones where profit-taking could slow upward momentum.
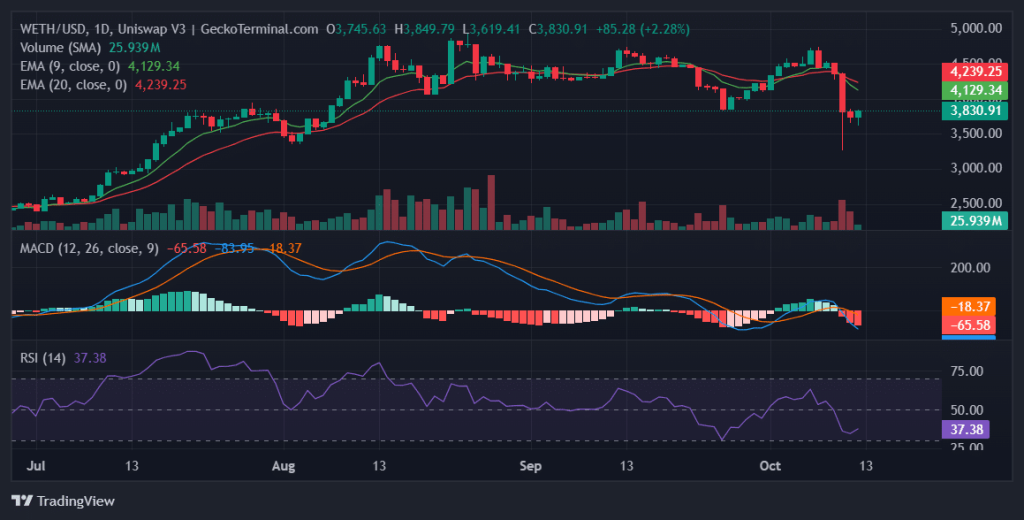
Daily chart for WETH/USD (Source: GeckoTerminal)
On the downside, $3,628, $3,469, and $3,393 stand as crucial supports that buyers must defend to prevent a deeper correction.
If Ethereum closes decisively above $3,865, traders could view it as confirmation of a short-term trend reversal. A drop below $3,628, however, might extend the correction before a stronger base forms.
Ethereum Trading Strategy: Patience for Confirmation
For bullish traders, maintaining entries above the $3,800 zone appears favorable, with upside targets around $3,865 and $3,986. Setting stops slightly below $3,620 ensures protection if support collapses.
For bearish traders, any sharp rejection from the $3,850–$3,865 resistance range could offer short opportunities toward $3,628, though strong bid liquidity may slow the decline.
Overall, Ethereum’s technical landscape suggests a cautiously bullish bias, but confirmation through a breakout above resistance is essential before momentum can truly shift upward.
Outlook: Bulls Regaining Control, But Not Yet Victorious
Ethereum’s chart shows early signs of recovery as indicators improve and buyers re-emerge around key supports.
The next few sessions will be critical — a successful defense of the $3,800 level paired with a breakout above $3,850 could validate the start of a new short-term uptrend.
Disclaimer: The information presented in this article is for informational and educational purposes only. It does not constitute financial advice. Ecoinimist is not responsible for any losses incurred. Readers should exercise caution before acting on this content.


