Bitcoin Struggles for Direction with Bulls Defending Key Support
Bitcoin (BTC) is entering a decisive phase on the daily chart as bulls and bears battle around critical resistance near $111,700. After a sharp rebound from sub-$111,000 territory, Bitcoin’s momentum indicators are sending mixed signals, hinting that the market could be preparing for its next major move.
Bitcoin Bulls Show Signs of Recovery, but Resistance Looms
Recent Bitcoin price action suggests BTC is regaining composure following a sharp correction. The 9-day exponential moving average (EMA) remains above the 20-day EMA, indicating short-term bullish control, though the gap between them has narrowed. This compression often precedes volatility, suggesting a potential breakout is on the horizon.
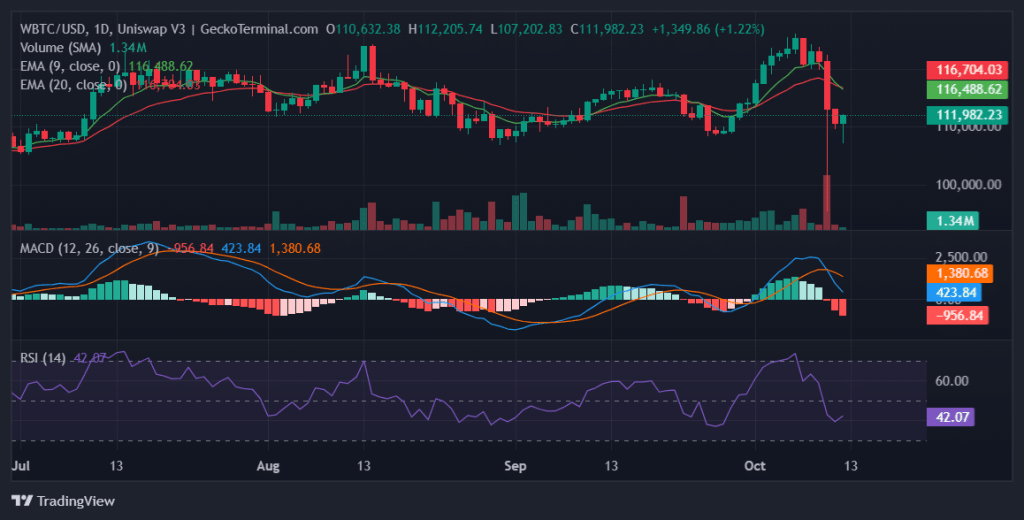
Daily chart for WBTC/USD (Source: GeckoTerminal)
However, with Bitcoin currently trading near overlapping resistance zones at $111,696 and $111,705, buyers may struggle to push the price decisively higher without renewed volume. A break above these resistance points could open the path toward $117,073 — a level that aligns with previous rejection zones and the upper boundary of the EMA envelope.
Support Zone Holds as Buyers Defend Territory
On the downside, the market has found strong footing between $108,994 and $108,246. This region aligns closely with the 20 EMA and prior consolidation areas, making it a key battleground for bulls defending against further downside.
Should selling pressure intensify, the next safety net lies near $105,681 — a deeper support level that could attract dip buyers eyeing value entries.
Bitcoin Momentum Indicators Reveal Waning Bullish Energy
The MACD remains in positive territory, but its histogram has started to contract, suggesting momentum may be fading after the recent bounce. This flattening often precedes a potential crossover that could signal short-term weakness.
Similarly, the Relative Strength Index (RSI) has recovered from oversold conditions but remains below the overbought threshold, showing that bulls have room to run — yet the conviction isn’t as strong as it was during the last rally phase.
Overall, the indicator mix paints a picture of cautious optimism: bullish structure persists, but momentum is fragile.
Order Book Signals Short-Term Tensions
The order book data underscores just how tight the current standoff is. On the buy side, a prominent bid wall sits at $111,689 with about 7 BTC (≈786,423 USDT). If this wall breaks, Bitcoin could slip roughly -0.01%, while smaller bid walls at $111,426 and $111,638 may provide short-lived defense.
Conversely, sellers have set up barriers at $111,798 and $111,742, where clearing these ask walls could push BTC up about 0.1% to the next resistance band. The close clustering of these walls reflects uncertainty and low conviction — traders are likely waiting for a stronger directional catalyst before committing to larger positions.
Potential Trade Setups
For bullish traders, a confirmed breakout above $111,705 with strong volume could present a potential long entry, targeting the $117,000 zone as an upside objective. Stop-losses could be placed below the $108,246 support to manage risk.
Conversely, bearish traders may watch for rejection signals near the current resistance range. A decisive move below $108,994 could open the door for short setups aiming toward $105,681, though traders should be wary of sharp rebounds from these high-demand zones.
With both moving averages converging and the MACD softening, Bitcoin’s next big move may depend on whether buyers can muster enough strength to reclaim lost momentum — or if sellers seize control for another leg lower.
Disclaimer: The information presented in this article is for informational and educational purposes only. It does not constitute financial advice. Ecoinimist is not responsible for any losses incurred. Readers should exercise caution before acting on this content.