
XRP Market Update: Bearish Momentum Meets Strong Bid Walls
XRP has been consolidating just under major resistance, with technical signals showing a cautious market tone.
After a series of lower closes, buyers are struggling to regain momentum as price trades below both the 9-day and 20-day exponential moving averages (EMAs). This positioning often reflects short-term bearish pressure, with sellers maintaining control until buyers can push back above those averages.
XRP Technical Indicator Overview
The Moving Average Convergence Divergence (MACD) continues to print negative values, highlighting that momentum is tilted to the downside.
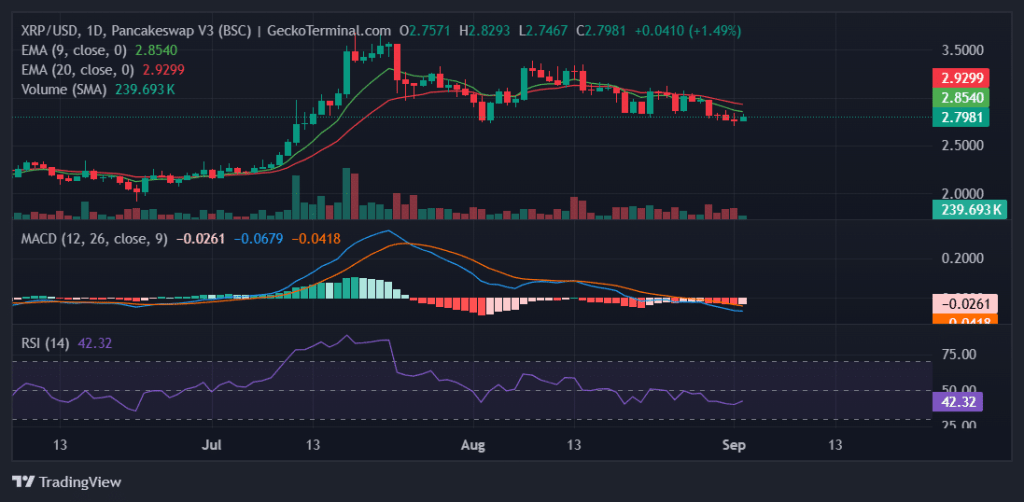
Daily chart for XRP/USD (Source: GeckoTerminal)
At the same time, the Relative Strength Index (RSI) is hovering in the low 40s, which suggests that while XRP is not oversold, it is in a zone where selling pressure outweighs demand.
The lack of strength in momentum indicators confirms that bulls have work to do before any sustainable rally can materialize.
Resistance and Support Levels
XRP faces immediate resistance at $2.9396, followed by higher barriers at $3.1276 and $3.2922. A decisive break above these levels would shift the short-term outlook back toward bullish territory.
On the downside, initial support lies at $2.7695. If this fails, deeper retracements could test the $2.3531 and $2.3250 zones, which represent more critical longer-term safety nets for bulls.
Order Book Dynamics
The order book offers additional insight into near-term volatility. A significant ask wall at $2.8400 with nearly 334,000 XRP could temporarily cap upside moves.
Clearing it, however, could pave the way for a 1.47% push higher. A larger cluster of asks sits at $2.9000, where more than 315,000 XRP are positioned, creating a strong supply zone that aligns with the first major resistance. If bulls manage to absorb this liquidity, a run toward $2.94 and beyond becomes feasible.
On the other side, bid walls at $2.7898 and $2.7500 provide near-term cushioning, but a break below these levels could trigger sharper losses. Notably, the largest protective wall sits at $2.7000 with nearly 267,000 XRP. If this level were to give way, the market risks a 3.5% drop, which could push XRP directly into the deeper support zones.
XRP Trading Strategy Considerations
For long traders, a breakout above $2.94 would be a potential entry trigger, with targets toward $3.12 and $3.29 if momentum strengthens.
However, caution is warranted until XRP can sustain closes above its short-term EMAs, as the price rejection around resistance would favor the bears.
Short traders may look for opportunities near $2.90–$2.94, where strong ask walls and resistance converge. Failed attempts to break this zone could provide entry points for downward moves targeting $2.77 and $2.70 initially.
The overall picture remains cautiously bearish in the short term, but order book imbalances suggest that a break in either direction could quickly accelerate XRP price action. Traders should remain attentive to liquidity shifts around the $2.84–$2.90 range and the $2.70 support line for signals of the next major move.
Disclaimer: The information presented in this article is for informational and educational purposes only. It does not constitute financial advice. Ecoinimist is not responsible for any losses incurred. Readers should exercise caution before acting on this content.


