EOS Consolidates Near Crucial Levels—Breakout or Breakdown Ahead?
EOS appears to be navigating a zone of indecision, as the daily chart shows the price attempting to hold support while momentum indicators begin to cool off after a brief upside push. Following a sharp dip toward the $0.75 range, EOS rebounded modestly, but now faces a wall of resistance just above the $0.78 mark.
Whether bulls can reclaim lost ground or bears reassert dominance depends heavily on upcoming price action near key technical levels.
The 9-day EMA has remained above the 20-day EMA over the past few sessions, indicating that short-term momentum had favored the bulls. However, the gap between the moving averages is narrowing, and the price has been trending below the 9 EMA recently—suggesting that bullish momentum is weakening. If this crossover continues to compress, we could see a bearish shift in the coming sessions.
The Relative Strength Index (RSI) has hovered in neutral territory between 47 and 55. This range implies a lack of decisive direction, with neither buyers nor sellers in full control. While not yet in oversold territory, the declining trend in the RSI reflects fading strength from earlier bullish attempts.
MACD Indicates Waning Bullish Momentum
The MACD has gradually lost upward momentum. The histogram has now turned negative and has been increasing in bearish intensity over the past five sessions. Although the MACD line remains above the signal line for now, the divergence is shrinking and suggests that any further downside price action could solidify a bearish crossover. This adds caution for bulls hoping for a breakout.

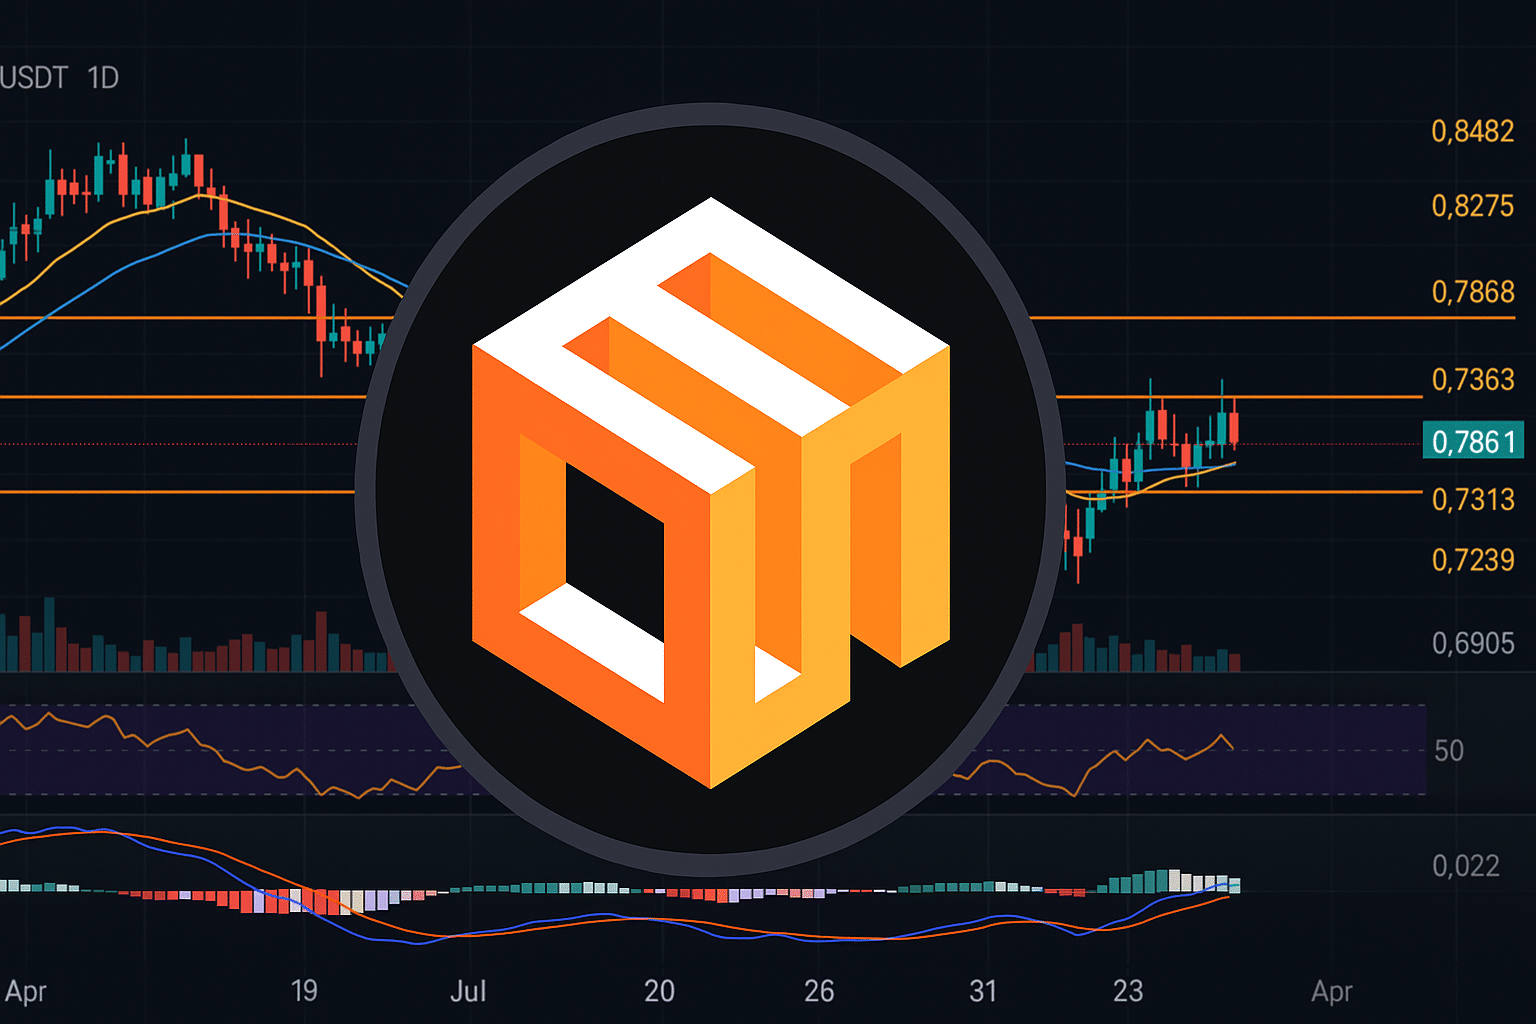
Daily chart for EOS/USD (Source: GeckoTerminal)
EOS is currently trapped between critical levels. Immediate resistance stands at $0.7868, which has rejected price attempts several times. Above that, the $0.8275 and $0.8482 zones are formidable ceilings that would require strong volume to overcome. These levels mark potential take-profit zones for traders entering long positions on a breakout.
On the downside, the support at $0.7527, near the recent low, is pivotal. A break below could trigger a descent toward $0.7313, and eventually down to $0.7239 and $0.6905—levels that historically acted as demand zones and may attract buying interest again.
EOS Trade Setups and Scenarios
For bullish traders, a confirmed daily close above $0.7868, especially with renewed strength in RSI and MACD flipping back to a positive histogram, could present a potential long entry. Profit-taking could be staged near the $0.8275 and $0.8482 resistance bands. Stop-loss placements just below the $0.7527 support may protect capital in case of a failed breakout.
Conversely, traders leaning bearish may look for short opportunities if EOS breaks below the $0.7527 mark on strong volume, with downside targets set at $0.7313 and $0.7239. Any breakdown below $0.7239 opens the door for a retest of the $0.6905 level. Short entries could be further supported by a bearish MACD crossover or a drop in RSI toward the 40 zone.
The EOSUSDT daily chart suggests that the market is at a crossroads. Bulls have maintained a fragile grip on short-term momentum, but it’s slipping. Without a convincing move above resistance or a supportive bounce off the key EMA levels, EOS may struggle to sustain its recent gains. The coming days will likely determine whether EOS breaks out or succumbs to broader market pressure.
Until clearer confirmation arrives, traders may consider adopting a range-bound strategy, awaiting decisive moves beyond support or resistance to confirm direction.
Disclaimer: The information presented in this article is for informational and educational purposes only. The article does not constitute financial advice or advice of any kind. Ecoinimist is not responsible for any losses incurred as a result of the utilization of content, products, or services mentioned. Readers are advised to exercise caution before taking any action related to the company.


