
Is a Major Bullish Reversal Ahead for Notcoin Price After Wild Fluctuations?
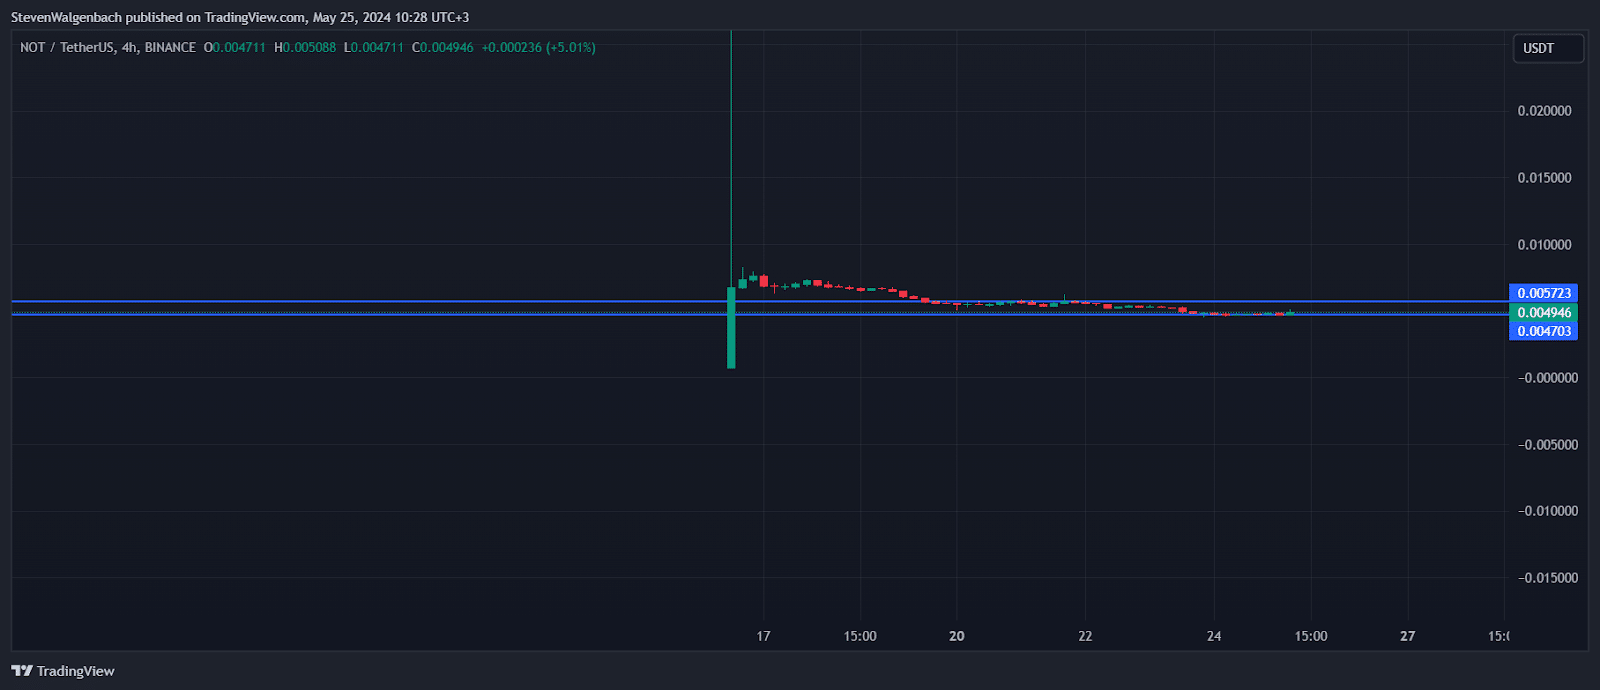
The Notcoin price surged over 6% in the last 24 hours to trade at $0.004951 at press time.
This comes after NOT displayed a notable fluctuation, ranging from $0.00471 to $0.004982. The recent data points to some interesting movements in relation to its technical indicators and key levels.
Notcoin Price Technical Overview
The closing prices have shown a mix of upward and downward movements with the most recent closing at $0.004982, indicating a potential reversal or pause in the previous downtrend. The 9 Exponential Moving Average (EMA) has declined slightly over the period, moving from $0.004906 to $0.004867. This suggests a deceleration in bullish momentum as prices dip below this EMA line, generally considered a bearish signal.
Also read: Alaya AI: Revolutionizing Technology with Advanced Machine Learning
Conversely, the 20 EMA tells a similar story with a decrease from $0.005177 to $0.005063. The current price sitting below the 20 EMA further confirms the bearish sentiment in the market. However, this needs to be taken with caution as the proximity of the price to this EMA could also suggest potential resistance or support formation.
The MACD indicator provides additional insight with its values showing a narrowing gap between the MACD line and its signal line, transitioning from a very slight bearish momentum to a more neutral stance. The histogram, moving from a negative to a more positive territory, reinforces this view. This suggests a decrease in downward momentum and possibly hinting at a bullish reversal in the near term.
RSI levels have been considerably low, with an initial reading of 28.67, which indicates an oversold market condition. The recent uptick to 42.77 could signal a reversal as buying interest increases, though it is still far from the overbought threshold of 70.
Potential Trade Ideas
Considering potential movements and the technical setup, the key resistance level to watch is at $0.005723. Meanwhile, the support level at $0.004703 could be crucial if the bearish trend resumes. Traders might consider entry points for long positions if the price sustains above the 9 EMA and shows continued momentum with supporting volume. Conversely, a break below the support level might be an opportunity for short positions, particularly if accompanied by bearish MACD and RSI confirmations.
Disclaimer: The information presented in this article is for informational and educational purposes only. The article does not constitute financial advice or advice of any kind. Ecoinimist is not responsible for any losses incurred as a result of the utilization of content, products, or services mentioned. Readers are advised to exercise caution before taking any action related to the company.


