
Solana Price Prediction: SOL at a Crossroads as it Tries to Break the Next Resistance
The Solana price slipped 1% in the last 24 hours and is trading at $144.80 at press time as a result.
Solana Price Outlook
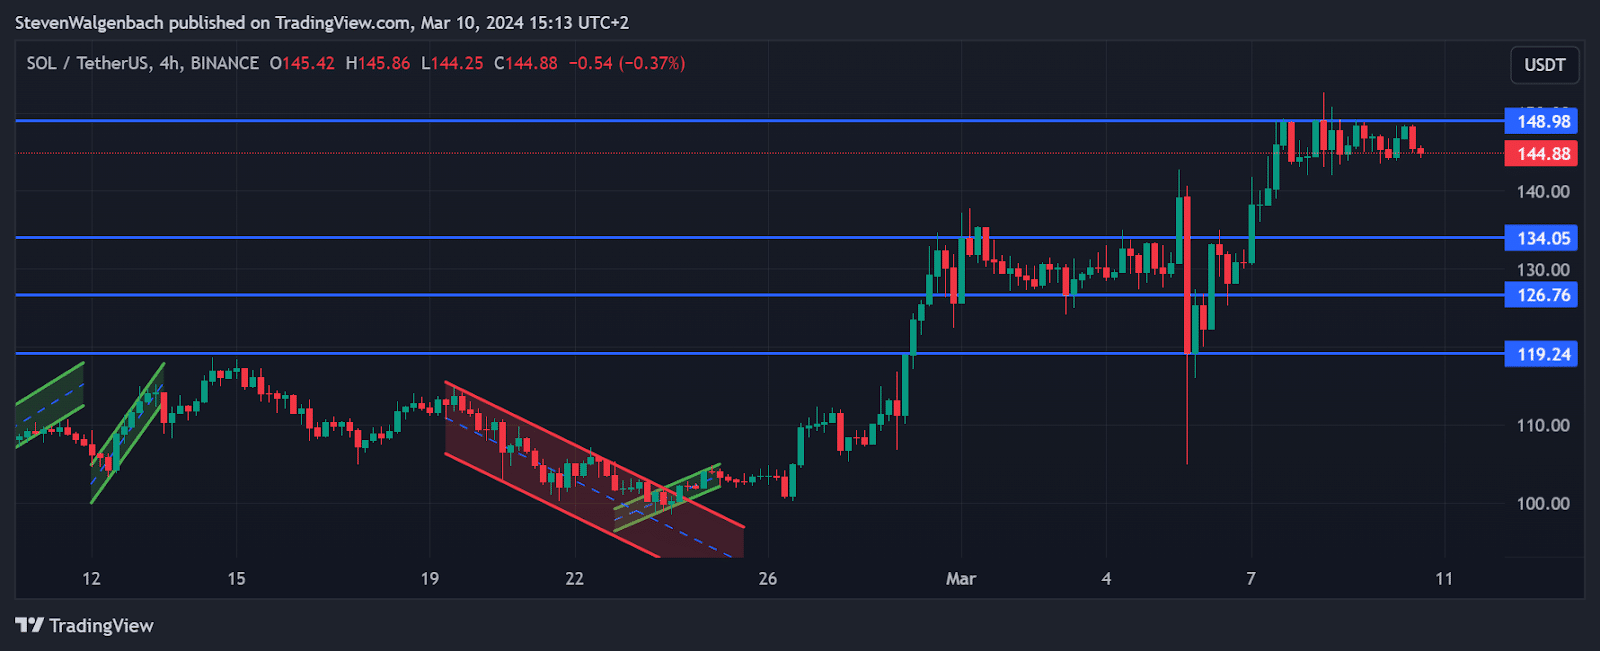
4-hour chart for SOL/USDT (Source: TradingView)
Over the past 48 hours, the Solana price has oscillated on the 4-hour chart, presenting a complex picture for potential investors. These closing prices have painted a volatile yet intriguing pattern for SOL.
Diving deeper into the technical analysis, the 9 Exponential Moving Average (EMA) and the 20 EMA indicators provide critical insights into the market’s momentum. The 9 EMA figures, while slightly declining, suggest a cautious optimism as they hover above the 20 EMA values. This indicates a bullish trend in the short term, as the price remains above both the 9 and 20 EMAs.
The Moving Average Convergence Divergence (MACD) offers a nuanced view of the market’s direction. Despite the MACD values showing a slight decrease – with the latest figures moving from 3.67 to 2.92 – the signal line’s decrease from 4.18 to 3.63 and the negative histogram values suggest a potential slowing of upward momentum, cautioning investors about possible volatility ahead.
The Relative Strength Index (RSI), a key indicator of the asset’s overbought or oversold condition, indicates neither an overbought nor an oversold market. This presents a neutral to slightly bullish scenario but calls for vigilance.
Key Levels to Watch
As traders navigate through this complex market, the resistance level at $148.98 and support levels at $134.04, $126.76, and $119.24 become crucial. A breakout above $148.98 could signal a strong bullish momentum, potentially opening long positions. Conversely, a drop below $134.04 could pave the way for bearish scenarios, where traders might consider short positions, especially if the price action threatens to breach lower support levels.
The blend of bullish and bearish signals from our technical indicators suggests a market at a crossroads. While the EMA indicators hint at a bullish outlook, the MACD analysis injects a note of caution. Thus, potential entry points for long trades could align with a solid breakout above resistance levels, especially if accompanied by increasing volumes and a bullish MACD crossover. For short trades, a breakdown below key support levels, validated by bearish MACD and RSI trends, might offer strategic entry points.
In conclusion, the SOL/USDT pair exhibits a tapestry of technical signals that offer opportunities for both bullish and bearish trades, depending on the prevailing market conditions. Traders are advised to remain vigilant, employing a balanced mix of indicators to guide their decisions.
Disclaimer: The information presented in this article is for informational and educational purposes only. The article does not constitute financial advice or advice of any kind. Ecoinimist is not responsible for any losses incurred as a result of the utilization of content, products, or services mentioned. Readers are advised to exercise caution before taking any action related to the company.


